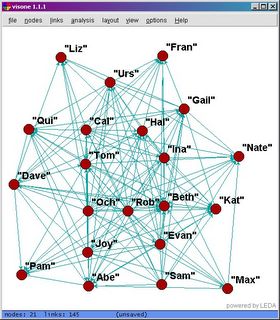
At the recent Sunbelt XXV conference, I realized you can't give a talk to a serious audience of social network analysts without saying "and here is the network" and putting up a slide like this:
Behold!
After puzzling over more than enough of these moments, I was relieved when their dreary predictability became a running Sunbelt joke. In the second half of the weeklong conference, spaghetti network pictures were still as common as ever, but more often than not they were announced with a knowing wink: "OK, everybody. Here comes the prerequisite spaghetti network.... And now back to the content of my talk."
Less academic audiences can get seriously put off by pictures like these. I can tell I've hit that terrible disconnect when I finish explaining SNA only to hear deep sighs, followed by "Wow, that's complicated."
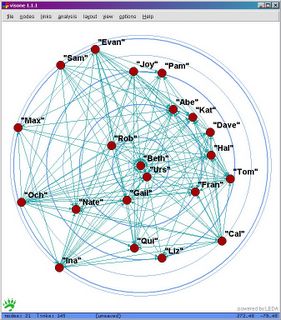
So let's hear it for Ulrik Brandes, Jorg Raab, and Dorthea Wagner. In their paper "Exploratory Network Visualization" they show how it's possible to convey much more than a plate of spaghetti with a network layout. Consider this depiction of the very same network we just saw, only this time configured to show in a very literal way who are the most central players in the network:
Could you tell how central Urs was in the orginal picture? Probably not, but the second picture is drawn so that you can't help but take in who is central in the network.
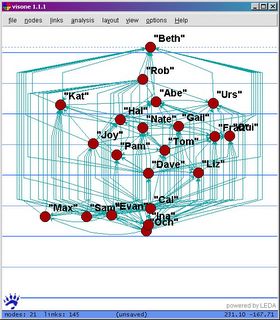
Now look at the network again:
Here we can't help but think, "Who is in charge?"
Whatever layout you use to display a network, it's important to respect the power of visualization. For better or for worse, these pictures will lead people to quick conclusions. For more about that, see my previous posts on this topic.
Wednesday, April 06, 2005
Subscribe to:
Post Comments (Atom)


No comments:
Post a Comment