I was channel surfing on my car radio yesterday when I caught this silly Internet song on WGBH, our local NPR station. I had stumbled onto Ellen Kushner's weekly program Sound & Spirit. This installment was an exploration of weaving and its significance across world cultures. Weaving isn't really my thing, but I just happened to catch the moment when Kushner explained how the connection between weaving and the web is much more than metaphorical. It all starts around minute 17 of this complete recording of the show.
If you're curious to know more about how the computer under your fingertips owes its logic to the shirt on your back, be sure to look up Charles Babbage, the genius whose "Analytical Engine" revolutionized both weaving and computing, though in the latter case only after several generations.
This story brought up some old memories for me. Babbage was a key figure in a famous installment of James Burke's 1980s show Connections, which ranks right up there with Carl Sagan's Cosmos in my pantheon of formative TV. (The similarity in program names chosen by Burke and myself is no accident.)
What I never knew about Babbage was his relationship to Alfred, Lord Tennyson, the Poet Laureate of England. Kushner touched on this in her program and shared a lovely musical rendition of Tennyson's epic poem "The Lady of Shalott." It's the story of a beautiful woman who is a fantastically talented weaver. She is cursed to live high in a castle tower, where she can only observe the world as it is reflected in a mirror by her window. Finally she can stand the isolation no longer... and you'll have to read the poem to find out what happens.
Were the Lady of Shalott with us today, would she be a web-surfing blogger?
Sunday, June 05, 2005


Wednesday, June 01, 2005
Kate Ehrlich Speaks on Collaboration and Social Network Analysis
The Boston KM Forum hosts monthly discussions on knowledge management. The conversations often delve into tools and technology that don't interest me much, so I miss more meetings than I attend, but it is a good forum for Boston-area KM professionals to keep on their radar.
This month features a couple interesting events. One I will be sure to attend is a presentation by Kate Ehrlich on June 16. Kate works in IBM's Collaborative User Experience Group, and fittingly enough will speak about "Collaboration revealed through social network analysis."
Kate last graced the pages of Connectedness after she and I spoke about maximizing influence through a social network (which generated this followup on finding key players in a network).
When I most recently met with Kate, we talked about more basic challenges, like educating people about what SNA is good for. Kate is contributing to that cause through her ongoing research and publishing, including her leadership of the the innovation project at the Network Roundtable.
This month features a couple interesting events. One I will be sure to attend is a presentation by Kate Ehrlich on June 16. Kate works in IBM's Collaborative User Experience Group, and fittingly enough will speak about "Collaboration revealed through social network analysis."
Kate last graced the pages of Connectedness after she and I spoke about maximizing influence through a social network (which generated this followup on finding key players in a network).
When I most recently met with Kate, we talked about more basic challenges, like educating people about what SNA is good for. Kate is contributing to that cause through her ongoing research and publishing, including her leadership of the the innovation project at the Network Roundtable.
Tuesday, May 31, 2005
The Network Roundtable is off and running
Rob Cross recently kicked off the Network Roundtable at the University of Virginia. Stay tuned to this initiative over the coming months; it is sure to generate useful insights in driving business results with the power of social network analysis. There are six applied research projects already underway:
• Client Connectivity: Generating Value at the Client Interface with Network Analysis
• Innovation: Driving Innovation and Top Line Revenue Growth with a Network Perspective
• Leadership Development: Enhancing Leadership Effectiveness and Resilience via Network Management
• Organizational Change: Facilitating Large Scale Change with a Network Perspective
• Well-Being at Work: Promoting Employee Well-Being through Relational Constellations at Work
• Communities of Practice: Assessing and Supporting Communities of Practice with Network Analysis
For a close-up look at Organizational Change, be sure to follow Patti Anklam's blog. She is co-leading that particular project with Nat Welch.
• Client Connectivity: Generating Value at the Client Interface with Network Analysis
• Innovation: Driving Innovation and Top Line Revenue Growth with a Network Perspective
• Leadership Development: Enhancing Leadership Effectiveness and Resilience via Network Management
• Organizational Change: Facilitating Large Scale Change with a Network Perspective
• Well-Being at Work: Promoting Employee Well-Being through Relational Constellations at Work
• Communities of Practice: Assessing and Supporting Communities of Practice with Network Analysis
For a close-up look at Organizational Change, be sure to follow Patti Anklam's blog. She is co-leading that particular project with Nat Welch.
Friday, May 27, 2005
Mining Social Networks from Email
I recently acquired a couple new toys--an IBM Thinkpad last month and a Canon Pixma multifunction printer/copier/fax/scanner just today. I go a while between upgrades so when the new stuff comes in it really blows me away. Today's revelation is optical character recognition, or OCR. How OCR works I have no idea but here's what it can do:
My regular readers may have already detected that I am a New Yorker magazine junkie. My friends can hardly fail to notice this, since I am always saying, "Yes, and that reminds me of an article I just read in the New Yorker," at which point I take over the conversation for a few minutes. In the olden times (before today) that was more than enough for my friends. But as of today it is just the beginning. Now I can go home to my personal NYer archives (dating from 9-11), grab the issue in question, put it through my scanner, and sit back while my computer receives the entire article in the form of a Word document (with columns, pages, and cartoons all properly configured) or a PDF (with text searching). I leave the rest of the story to your imagination, since this is a copyright-friendly blog.
If any of you just happen to be thinking about email right now, let me say--that reminds me of a great article I just read in the New York Times: "Enron Offers an Unlikely Boost to E-Mail Surveillance." I am a bit embarassed to be mentioning this article now. It was published very prominently on Sunday. But I have been so preoccupied with my new ThinkPad that real life is apparently passing me by. So thanks to Jim Murphy for clipping the article and handing it to me, in a quaint nod to life before scanners. Jim's gift prompted me to check Patti Anklam's blog and see her review of the article which she wrote the day after its publication.
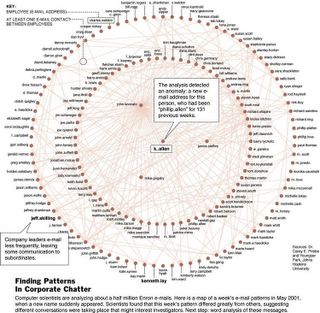
The gist of the story is that a huge pile of Enron email is now publically available. The email provides a detailed look at communication from before the California energy crisis right up to the final bankruptcy scandal. This is an unprecendented resource for sociologists and computer scientists, who have proceeded to demonstrate not only the power of textual analysis (how often do people say "Dynergy" or "bankruptcy" week by week) but also the power of network analysis (who sends email to whom and when, regardless of the content).
The article features a beautiful network diagram:
My regular readers may have already detected that I am a New Yorker magazine junkie. My friends can hardly fail to notice this, since I am always saying, "Yes, and that reminds me of an article I just read in the New Yorker," at which point I take over the conversation for a few minutes. In the olden times (before today) that was more than enough for my friends. But as of today it is just the beginning. Now I can go home to my personal NYer archives (dating from 9-11), grab the issue in question, put it through my scanner, and sit back while my computer receives the entire article in the form of a Word document (with columns, pages, and cartoons all properly configured) or a PDF (with text searching). I leave the rest of the story to your imagination, since this is a copyright-friendly blog.
If any of you just happen to be thinking about email right now, let me say--that reminds me of a great article I just read in the New York Times: "Enron Offers an Unlikely Boost to E-Mail Surveillance." I am a bit embarassed to be mentioning this article now. It was published very prominently on Sunday. But I have been so preoccupied with my new ThinkPad that real life is apparently passing me by. So thanks to Jim Murphy for clipping the article and handing it to me, in a quaint nod to life before scanners. Jim's gift prompted me to check Patti Anklam's blog and see her review of the article which she wrote the day after its publication.
The gist of the story is that a huge pile of Enron email is now publically available. The email provides a detailed look at communication from before the California energy crisis right up to the final bankruptcy scandal. This is an unprecendented resource for sociologists and computer scientists, who have proceeded to demonstrate not only the power of textual analysis (how often do people say "Dynergy" or "bankruptcy" week by week) but also the power of network analysis (who sends email to whom and when, regardless of the content).
The article features a beautiful network diagram:
Note the use of a hierarchical circular layout that places people in three categories: (1) periphery, (2) mid-level, and (3) core. That's a great way not to distract people with unnecessary detail.
The Enron analysis is being led by David Skillicorn, Kathleen Carley, and Michael Berry.
Want to try this at home? You can! Investigate your own email communication network by downloading Peter Gloor's TeCFlow.
The Enron analysis is being led by David Skillicorn, Kathleen Carley, and Michael Berry.
Want to try this at home? You can! Investigate your own email communication network by downloading Peter Gloor's TeCFlow.
Wednesday, May 25, 2005
Health Information Liquidity
Contemplate for a moment your medical history. Whenever you visit your doctor, she has your file handy; but what happens to that information when you're not there? Most of us probably trust that our records stay safely locked away--my records belong to me, not my doctor. But what if my bank managed my money the same way? Vast reserves of cash would sit unused while debt markets shriveled, and I would earn no interest on my savings. Security is only the first step of responsible stewardship.
This is the starting point of the exciting idea of "health information liquidity." I caught a hint of this idea listening to Tim Andrews introduce himself to a group several weeks ago. Just yesterday I finally sat down with Tim to hear about his work in more depth.
Tim is part of Transform Partners, which has joined forces with The Work Foundation to promote discussion about health care liquidity at the highest levels. Here is a nice article about the project and its goals, including a story illustrating how sharing our health records can protect us when we travel, drive significant advances in medical research, and earn us financial dividends as a result. (The analogy to financial liquidity seems to go pretty far.)
IBM's Almaden Institute hosted an all-star panel discussion on this topic a few weeks ago. Perhaps that's what caught James Surowiecki's eye. See "Local Knowledge," the latest installment of his weekly New Yorker column, for an unflattering look at information flow in healthcare. After describing the shocking degree to which the medical care you receive depends on where you happen to be at the time, Surowiecki concludes:
"In most professions... competition insures that, over time, good ideas are diffused through the whole system: people who don’t absorb and adapt fail. But medicine, which is in some ways quintessentially modern, is in other ways a throwback, a bastion of parochialism in a globalized age."
This is the starting point of the exciting idea of "health information liquidity." I caught a hint of this idea listening to Tim Andrews introduce himself to a group several weeks ago. Just yesterday I finally sat down with Tim to hear about his work in more depth.
Tim is part of Transform Partners, which has joined forces with The Work Foundation to promote discussion about health care liquidity at the highest levels. Here is a nice article about the project and its goals, including a story illustrating how sharing our health records can protect us when we travel, drive significant advances in medical research, and earn us financial dividends as a result. (The analogy to financial liquidity seems to go pretty far.)
IBM's Almaden Institute hosted an all-star panel discussion on this topic a few weeks ago. Perhaps that's what caught James Surowiecki's eye. See "Local Knowledge," the latest installment of his weekly New Yorker column, for an unflattering look at information flow in healthcare. After describing the shocking degree to which the medical care you receive depends on where you happen to be at the time, Surowiecki concludes:
"In most professions... competition insures that, over time, good ideas are diffused through the whole system: people who don’t absorb and adapt fail. But medicine, which is in some ways quintessentially modern, is in other ways a throwback, a bastion of parochialism in a globalized age."
Tuesday, May 24, 2005
Subtleties of Centrality
“Take me to your leader.” 
Centrality is one of the most basic social network concepts across the galaxy. And yet even for us professional social network analysts, this basic concept seems surprisingly slippery.
For those of you who have never thought about centrality formally, let me introduce you to the slipperiness with a little game: Who is the most central person in the network below?

Did you guess (1)? This person has more direct connections than anyone else. Or perhaps you guessed (6)? This person has fewer direct connections than (1) but is more central in the sense of influencing network-wide communication as it transfers through him.
The above puzzle is just the beginning of the surprising subtleties of centrality. To help us explore more deeply, Steve Borgatti recently published a basic checklist of questions we should ask before measuring centrality in our networks. These questions break into two families, approximated below:
One: What is the fundamental commodity that flows through the network? Is the commodity like a physical object that can only be in one place at a time? Or does it generate copies of itself (like an idea) and so occupy many places at once?
Two: What kinds of trajectories does the commodity follow through the network? Can it sensibly visit the same person or relationship more than once (like a dollar bill) or does it proceed directly from source to destination?
After presenting his checklist, Borgatti then surveys the literature on centrality. Here we find a bewildering array of formulae with names like degree, closeness, betweenness, information, and eigenvalue. Borgatti explains how each centrality measure assumes a certain set of answers to his two-dimensional list of questions. The resulting table exposes how centrality measures developed with one set of assumptions in mind are often applied to networks where these assumptions completely break down. For example, betweenness centrality assumes a network where flow moves along the shortest possible path from source to destination (like a package), and yet it is commonly used to measure influence in scenarios where shortest paths are hardly the only ones that matter. (Rhetorical question: Is the shortest path between HIV and you the only one you care about? Or do you care about all possible paths?) Borgatti’s table also exposes gaping holes in our understanding of centrality—for example, there are no established centrality measures for gossip or support networks.
For more on centrality, see Borgatti’s “Centrality and network flow” and other excellent articles in Social Networks 27 (2005) 55-71.
Centrality is one of the most basic social network concepts across the galaxy. And yet even for us professional social network analysts, this basic concept seems surprisingly slippery.
For those of you who have never thought about centrality formally, let me introduce you to the slipperiness with a little game: Who is the most central person in the network below?
The above puzzle is just the beginning of the surprising subtleties of centrality. To help us explore more deeply, Steve Borgatti recently published a basic checklist of questions we should ask before measuring centrality in our networks. These questions break into two families, approximated below:
One: What is the fundamental commodity that flows through the network? Is the commodity like a physical object that can only be in one place at a time? Or does it generate copies of itself (like an idea) and so occupy many places at once?
Two: What kinds of trajectories does the commodity follow through the network? Can it sensibly visit the same person or relationship more than once (like a dollar bill) or does it proceed directly from source to destination?
After presenting his checklist, Borgatti then surveys the literature on centrality. Here we find a bewildering array of formulae with names like degree, closeness, betweenness, information, and eigenvalue. Borgatti explains how each centrality measure assumes a certain set of answers to his two-dimensional list of questions. The resulting table exposes how centrality measures developed with one set of assumptions in mind are often applied to networks where these assumptions completely break down. For example, betweenness centrality assumes a network where flow moves along the shortest possible path from source to destination (like a package), and yet it is commonly used to measure influence in scenarios where shortest paths are hardly the only ones that matter. (Rhetorical question: Is the shortest path between HIV and you the only one you care about? Or do you care about all possible paths?) Borgatti’s table also exposes gaping holes in our understanding of centrality—for example, there are no established centrality measures for gossip or support networks.
For more on centrality, see Borgatti’s “Centrality and network flow” and other excellent articles in Social Networks 27 (2005) 55-71.
Friday, May 20, 2005
Grokker Maps the Information Community
One thing I love about social network analysis is how it goes beyond the org chart to identify which people, or which groups, are really connected or not. Sometimes you look at a network map and a group of people jumps out at you that you never even thought to recognize before.
Social network analysts aren't the only people interested in finding natural community clusters. Another great application is making sense of all the information on the Internet. I've been talking about that indirectly in this thread on Internet visualization, hoping all the while that some Internet techie would put these pieces together.
Of course, someone did put those pieces together several years ago, and I just found out about it today. I am happy to report that Grokker is here. Here's a nice article about it in a recent issue of the International Herald Tribune, which explains:
"Groxis, a San Francisco-based company that was founded in 2001, has converted its desktop Grokker software program, which displays a Web search as a series of categories set in a visual map, to run as a Java plug-in for browsers. "On Monday [May 9, 2005] the company will begin allowing computer users to view Yahoo search results with its visualization technology at www.groxis.com. "'We're not intent on replacing Google or Yahoo,' said R.J. Pittman, chief executive of Groxis. 'This is if you want to go deeper.'"
Below I show how Grokker gives me a nine-category breakdown of my query "social networks," including topics like "dynamics," "network analysis," "social capital," and "social software":

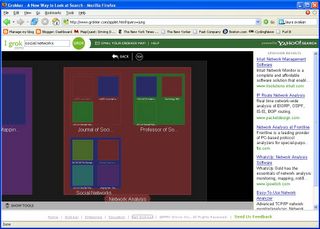
Then I can zoom in on the category of my choice, such as "network analysis," where I get to see topics like "journals," "professors," and "social networks":
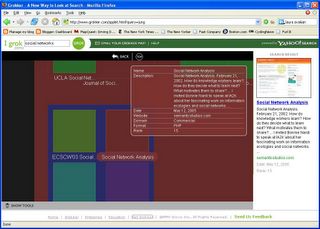
At any point I can select a specific web page, which brings up a descriptive balloon of text and the appropriate link info in a sidebar:
Social network analysts aren't the only people interested in finding natural community clusters. Another great application is making sense of all the information on the Internet. I've been talking about that indirectly in this thread on Internet visualization, hoping all the while that some Internet techie would put these pieces together.
Of course, someone did put those pieces together several years ago, and I just found out about it today. I am happy to report that Grokker is here. Here's a nice article about it in a recent issue of the International Herald Tribune, which explains:
"Groxis, a San Francisco-based company that was founded in 2001, has converted its desktop Grokker software program, which displays a Web search as a series of categories set in a visual map, to run as a Java plug-in for browsers. "On Monday [May 9, 2005] the company will begin allowing computer users to view Yahoo search results with its visualization technology at www.groxis.com. "'We're not intent on replacing Google or Yahoo,' said R.J. Pittman, chief executive of Groxis. 'This is if you want to go deeper.'"
Below I show how Grokker gives me a nine-category breakdown of my query "social networks," including topics like "dynamics," "network analysis," "social capital," and "social software":
Subscribe to:
Posts (Atom)


