How can we
contain the AIDS epidemic in Africa? How do
new ideas take hold in an organization? Social network analysts frame both of these questions in terms of diffusion. And as experts in the field, social network analysts might be expected to practice
optimal strategies in combatting STDs and spreading good ideas fast. But we are human too (thank god). So perhaps it is not surprising that I can still impress my colleagues as an innovator by sharing an article published twelve years ago in the Harvard Business Review.
The ancient scroll to which I refer is "
Informal Networks: The Company Behind the Chart" by
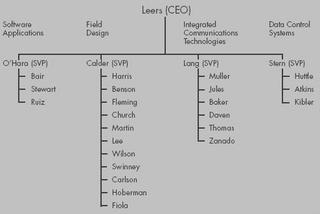
David Krackhardt and Jeffrey Hansen. The article features a case study of David Leers, CEO of a California computer firm:

When rivalries flare among his four divisions, Leers decides to bring key leaders from each division together into a strategic task force. His initial choice of leaders turns out to be off the mark, but a careful look at information, advice, and trust networks in the company helps him see how to resolve the situation.
As I mentioned, several colleagues of mine have been positively blown away by this article. So the big question is, how can an HBR article from 1993 still strike people as "the next big thing"? I went straight to the source and asked David Krackhardt that very question. Here's what he had to say:
"I think that one of the reasons is that there are a lot more software packages that support analyzing these networks in ways that were not possible before. Up until fairly recently, all of us in the field were also programmers, having to write our own code to do the analysis (and and visual renderings). Coupled with the high profile interest that physicists have taken in the area, and you have lots more exposure. And some of this work is also tapping into large scale networks, like the WWW or email connections, which in some ways is much easier data to collect and write about."
Speaking of software packages for SNA, I put David's HBR case study into
Steve Borgatti's
NetDraw and came up with this image of the advice network:

Each division is a different color. The size of the node corresponds to the
influence that individual has over the advice network. Then, since the trust network also plays a key role in this case study, I represented influence over the trust network by scaling the size of the node labels (i.e., trusted individuals literally have big names). Near the middle of the network, you can see a big yellow node illegibly labelled "Calder" because Calder is
so professionally competent and at the same time personally abrasive. Not necessarily good leadership material.
Unlike 1993, the problem with SNA today is preventing information overload. There are so many networks we can collect data on, and so many gee-whiz tools to display them, that it's important to keep focused on the
big picture.


