One paper you'll find in this syllabus makes a vivid point about the power of social network analysis (SNA). Many of us SNA fans are especially fond of its ability to put complicated organizational situations into a single compelling image.
Spend just a few minutes playing with UCINET, though, and you'll start to appreciate the amount of work that goes into the network images you find published. What looks straightforward and natural on screen (or paper) is actually the result of many complicated tradeoffs.
So yes, there are many powerful techniques that automatically draw networks on your screen so that all kinds of patterns practically jump out at you. But... there is no one best way that shows "what's really going on." This can put a lot of power in the hands of whoever draws the network.
To appreciate how much power there is to tell different stories through different pictures of the same social network, just look at this example from McGrath, Blythe, and Krackhardt in Social Networks 19:223-242:
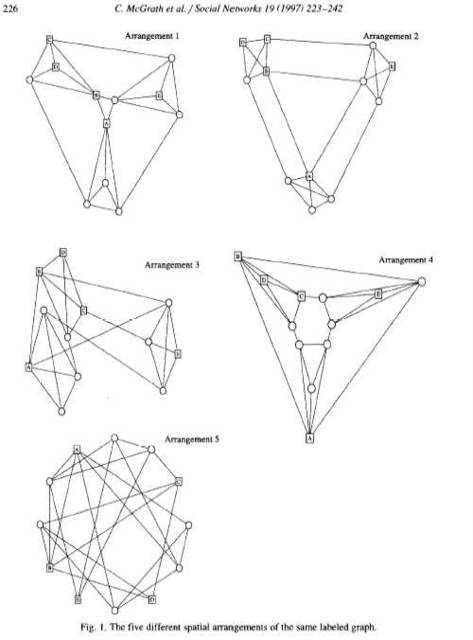
Who are the central actors? Who are the key bridges? How many groups are there? Each of these pictures can easily lead you to a different answer, even though they are all pictures of the same network.
As a colleague was reminding me the other day, "Social networks are good at suggesting what questions to ask, but dangerous to draw too many conclusions from."


1 comment:
See also http://connectedness.blogspot.com/2004/09/more-on-power-of-visualization.html
Post a Comment