To compensate for my reduced blogging, I am having my students blog for credit. They are going to complement that with basic web programming and some introductory social network analysis.
We started the social network analysis on the very first day of class. I had my students pair off
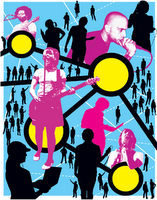
 and interview each other about their Internet preferences (PC vs Mac, IE vs Firefox, etc). You can see the resulting map of who paired with whom at right.
The map of pairings by itself is not so interesting, but it got more interesting at the end of class when I invited everyone to stand up and make an impromptu party at the front of the class. We took note of who clustered with whom. Below you can see red dots representing each of the 13 party clusters. Blue dots connected to red dots are students in the party clusters. Blue dots connected to blue dots are interview pairs from earlier in class.
 Showing students a map of how they connect with each other on the very first day of class provides a fun and meaningful springboard to consider how their blogs and other websites will be connecting later in the semester.
On another topic... if you're near Boston, come hear "KM meets OD" co-presented by Patti Anklam and me, Thursday evening Sept 14, hosted by the Mass Bay OD Learning Group.
This work is licensed under a Creative Commons Attribution-ShareAlike 2.5 License and is copyrighted (c) 2006 by Connective Associates except where otherwise noted.